The artifacts presented here offer a closer look at how we approach complex urban questions—from framing the problem and identifying the right evidence to connecting spatial, transportation, development, and policy considerations. Each example reflects a different analytical challenge, but together they demonstrate a consistent approach: disciplined inquiry, transparent reasoning, and work designed to turn complex information into insights that are clear, credible, and useful.
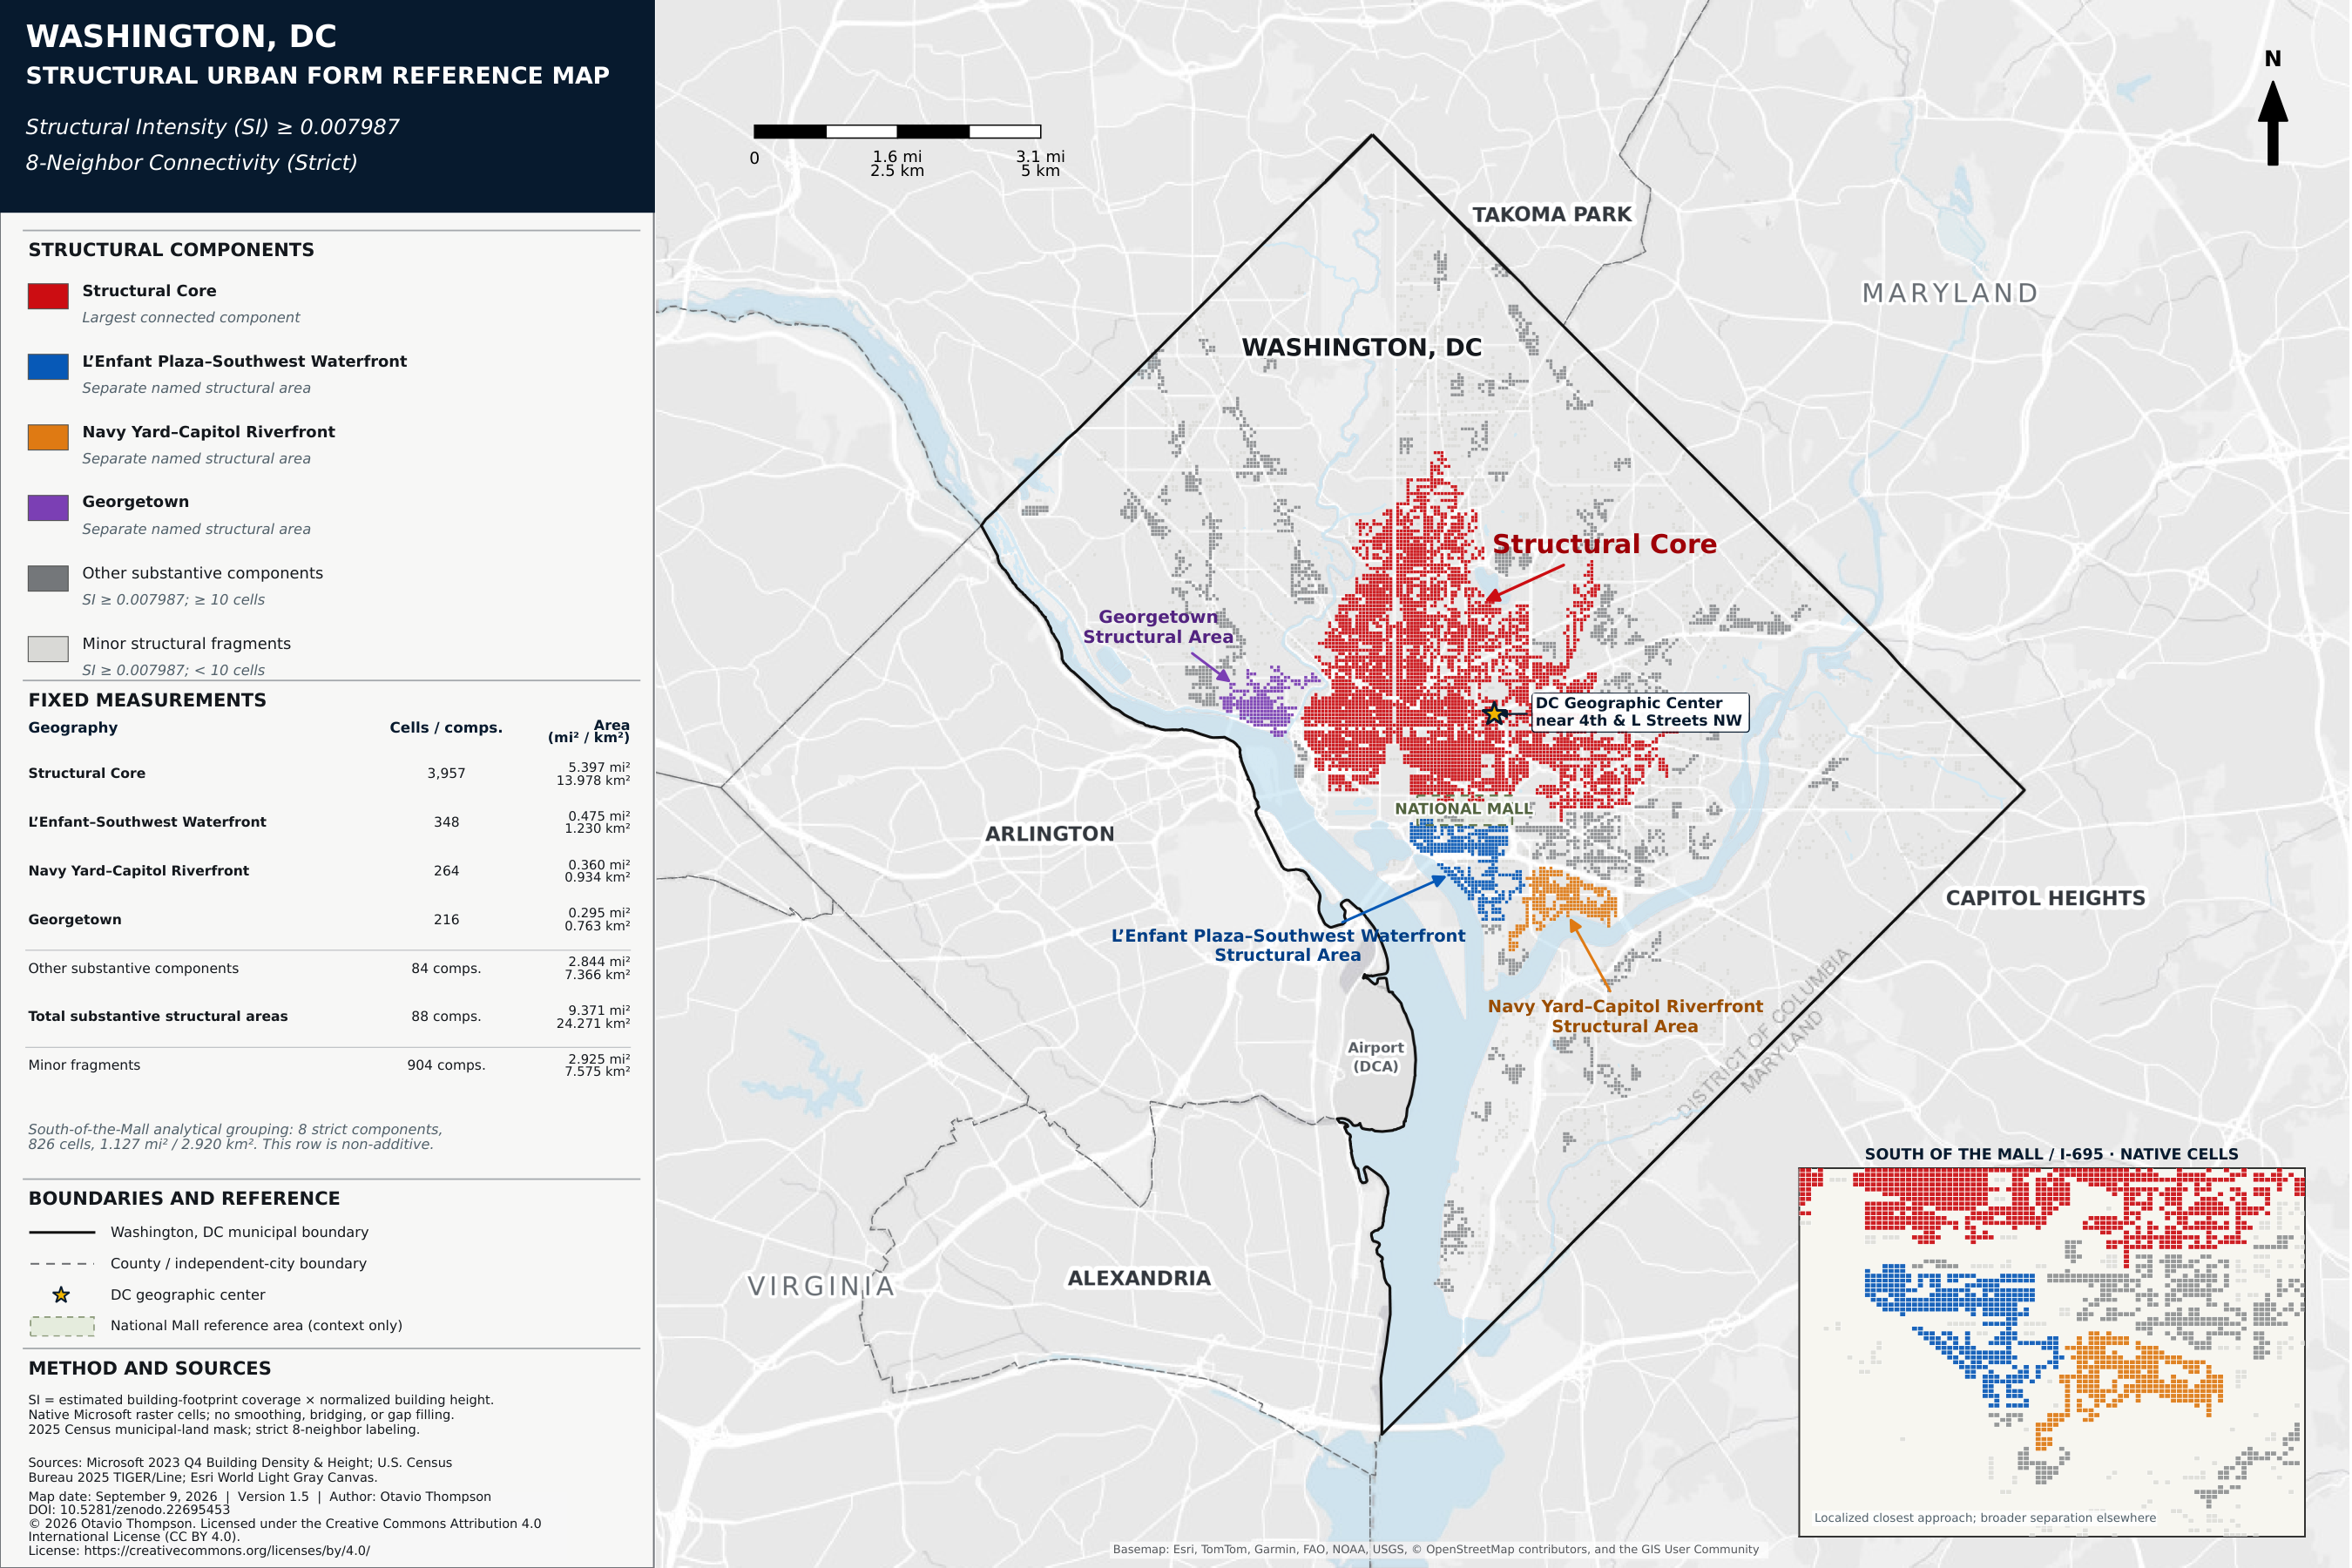
Washington, DC Structural Urban Form Reference Map
Maps Washington, DC’s Structural Core and three named separate structural areas—Georgetown, L’Enfant Plaza–Southwest Waterfront, and Navy Yard–Capitol Riverfront—using all-building Structural Intensity, not population density, with component measurements and regional reference geography.
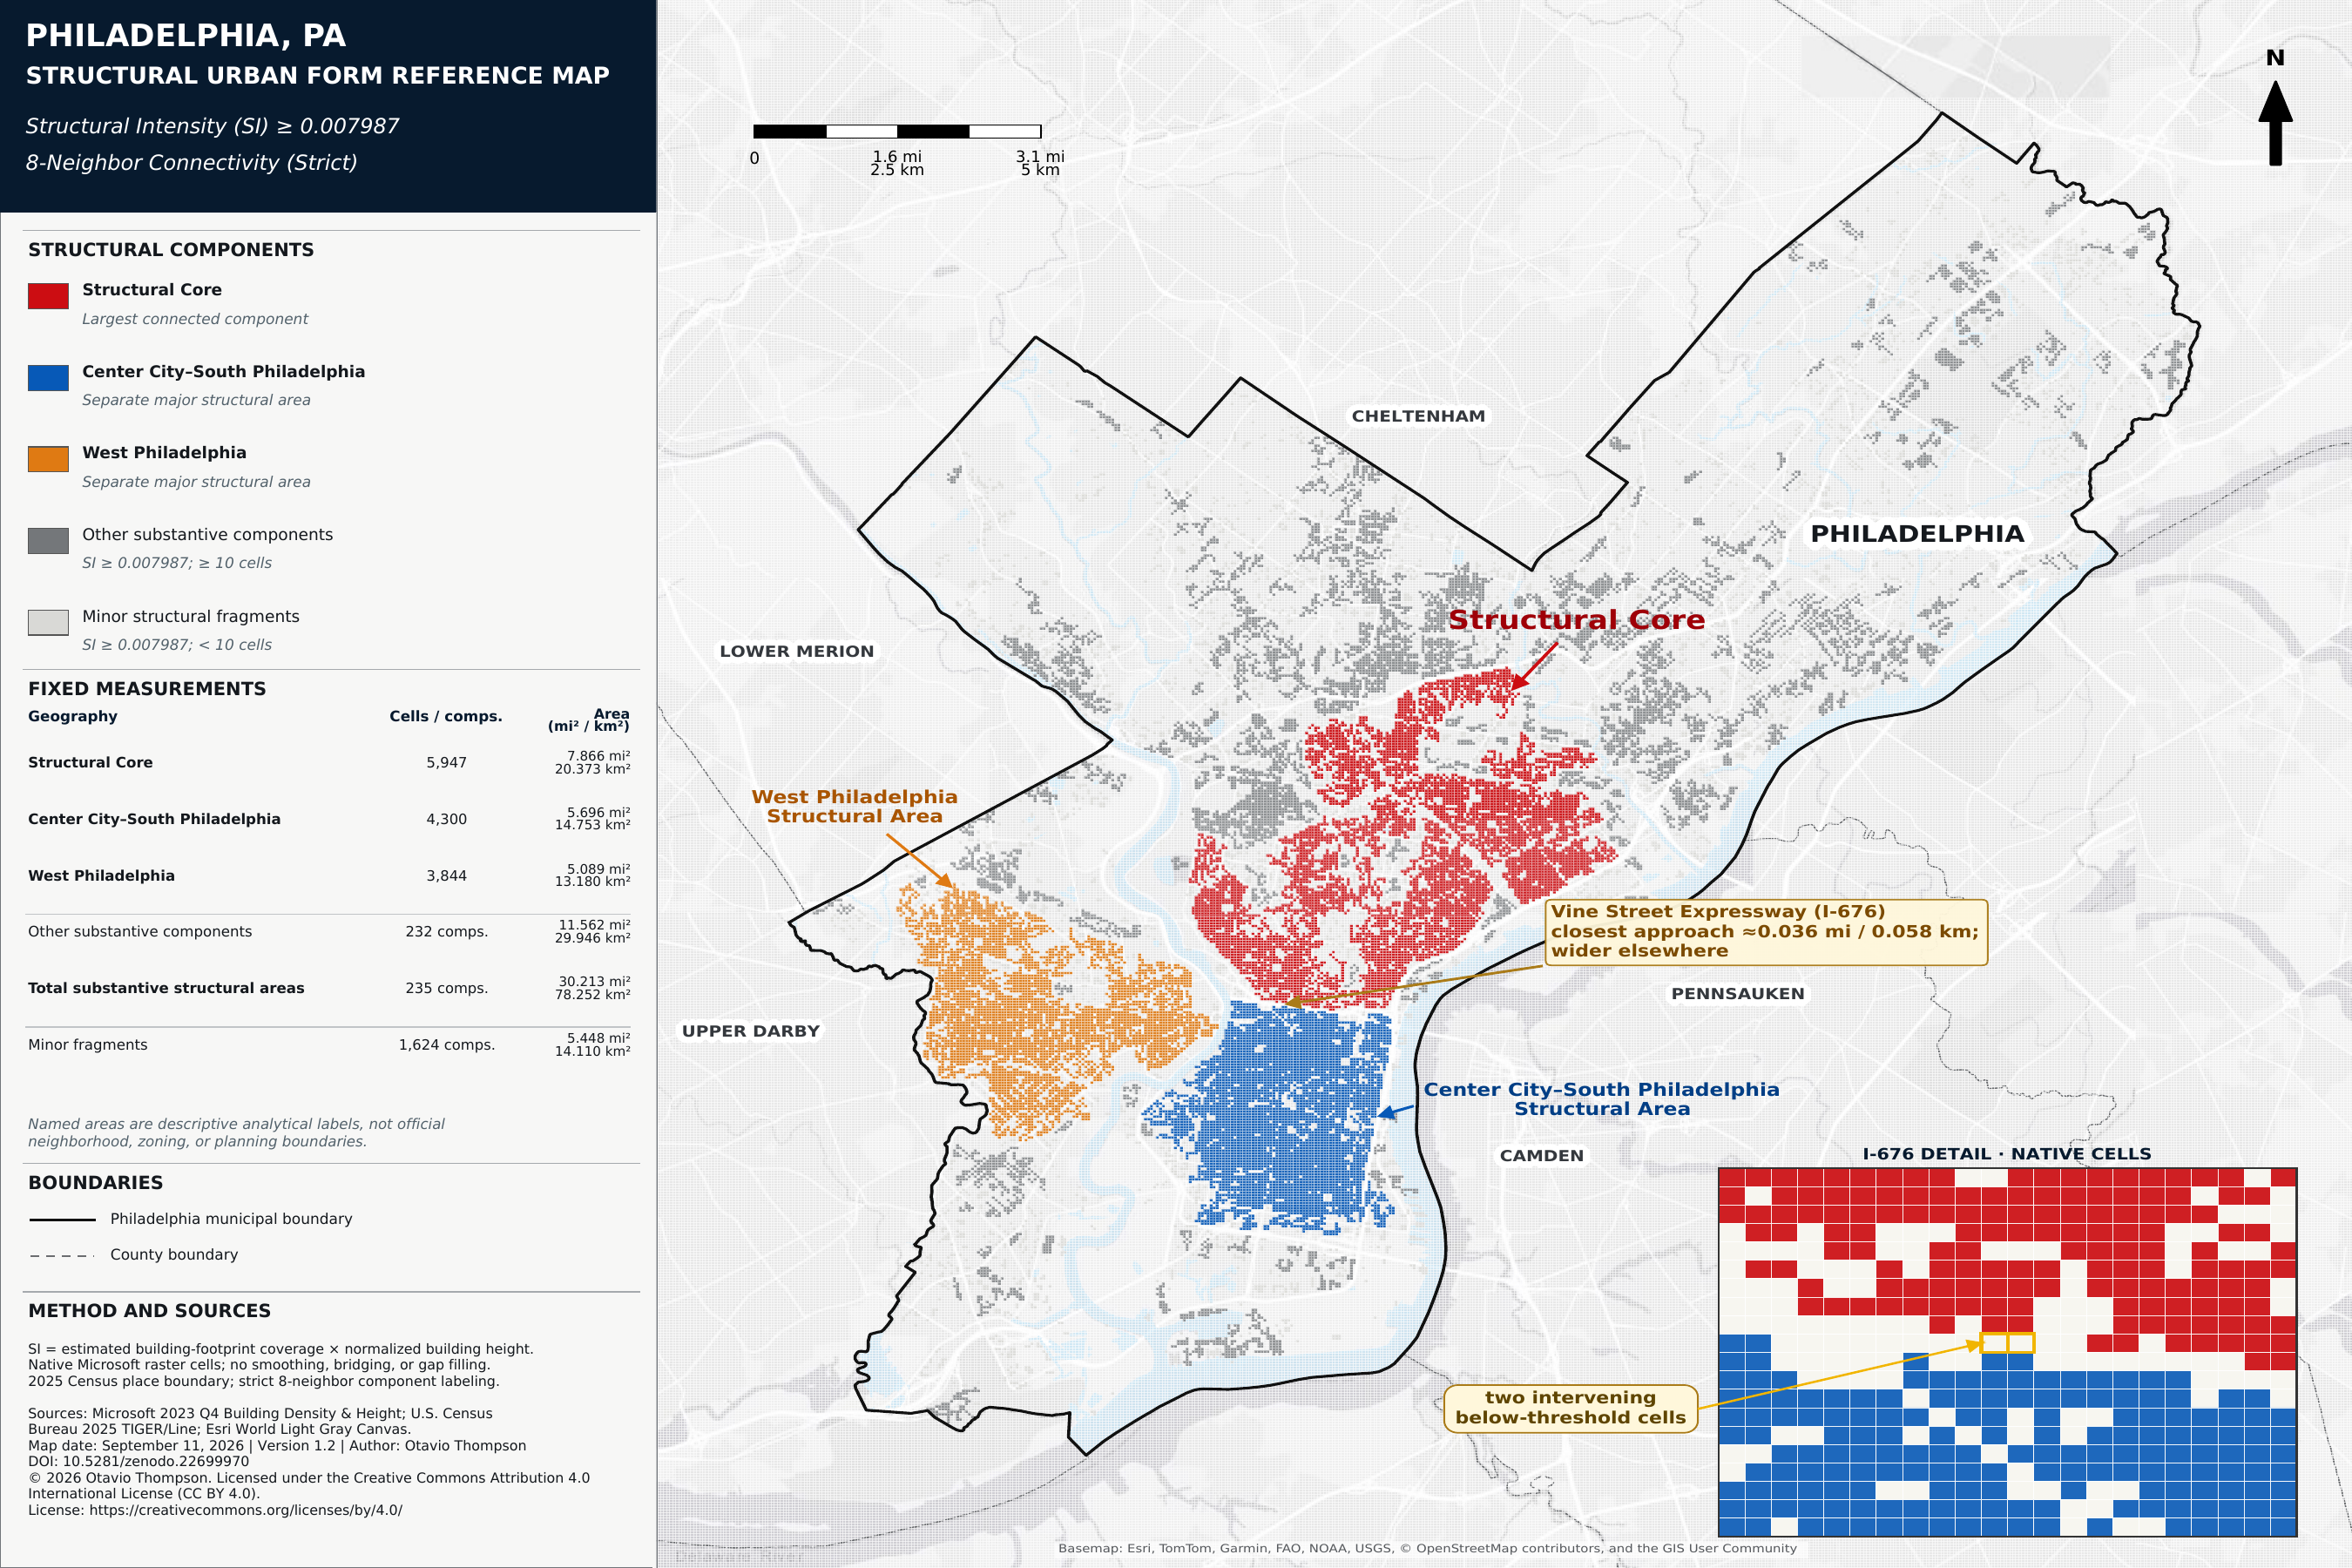
Philadelphia, PA Structural Urban Form Reference Map
Maps Philadelphia’s Structural Core and separate major structural areas using the fixed all-building Structural Intensity method.
Although the Center City–South Philadelphia Structural Area contains the city’s established business district, the largest contiguous component of qualifying SI cells—the Structural Core—extends across much of North Philadelphia into the lower Northeast.
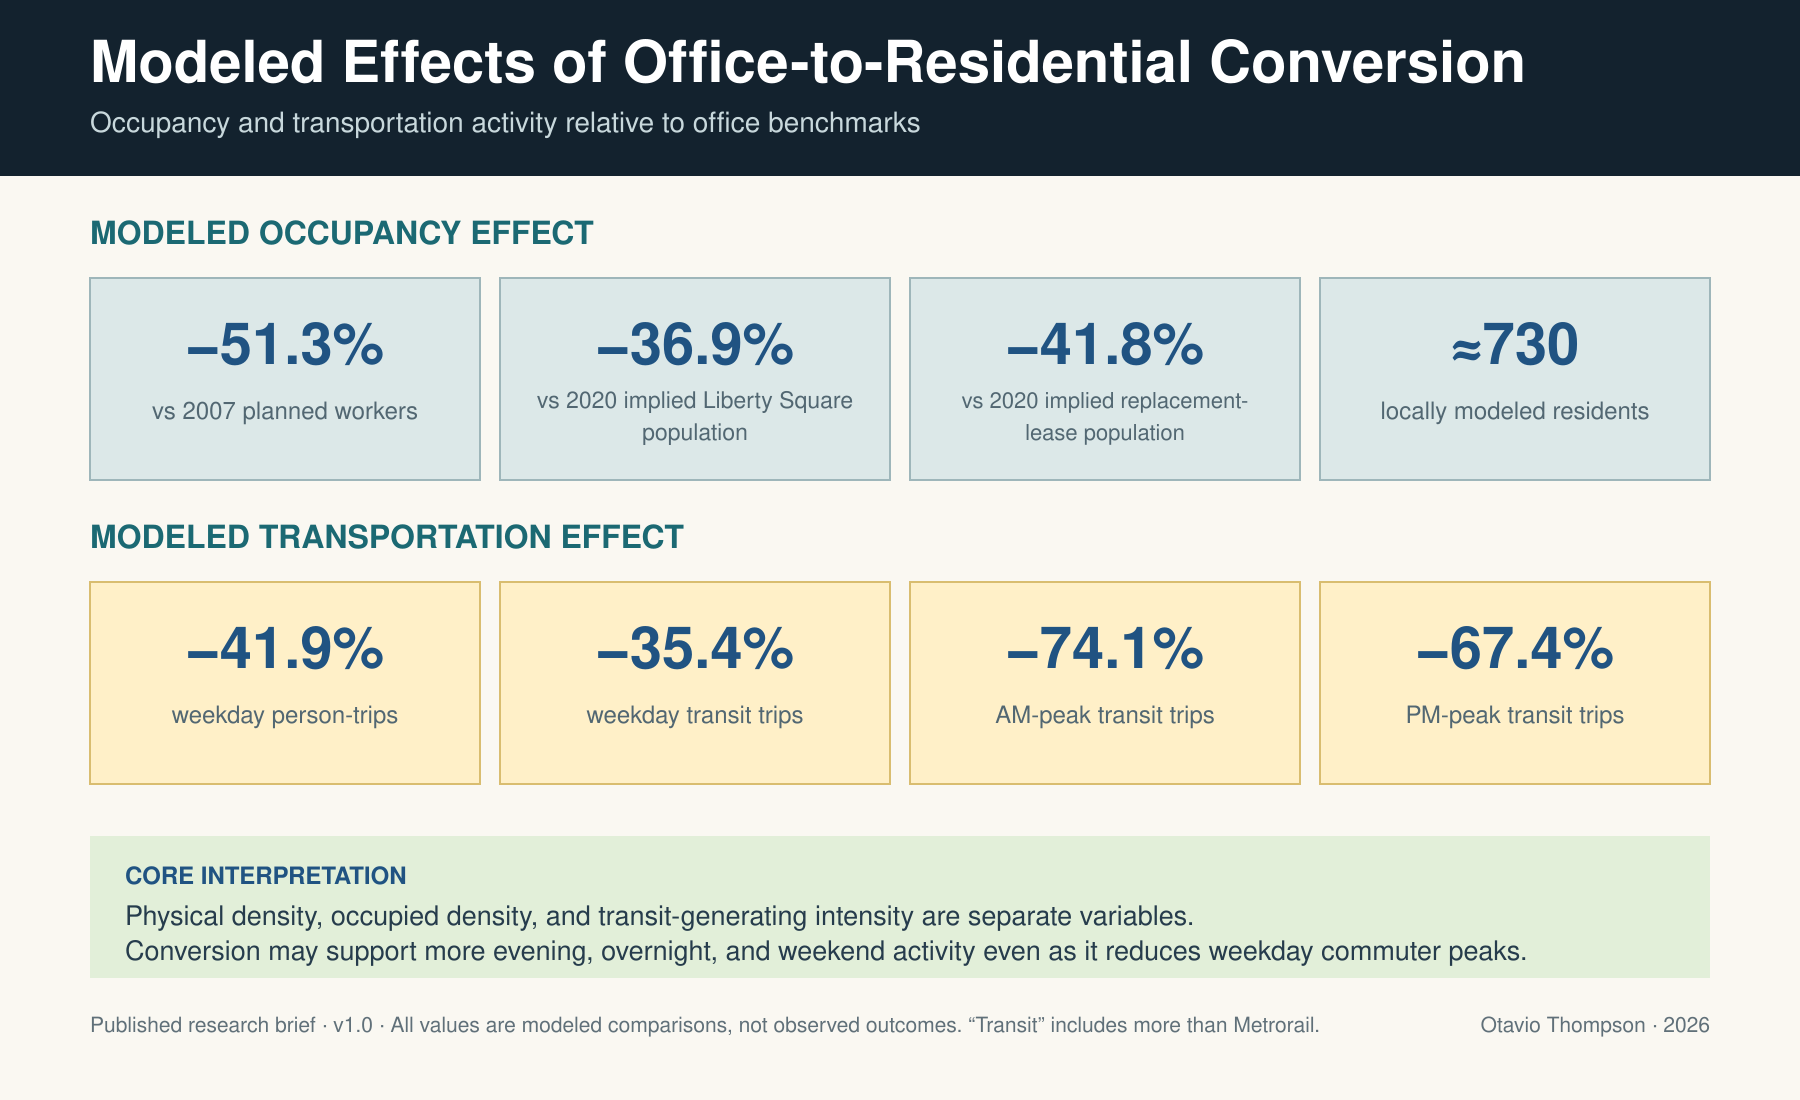
Modeled Effects of Office-to-Residential Conversion
Examines how converting a downtown office building to residential use changes modeled occupancy and transportation activity relative to historical and contemporary office benchmarks, distinguishing added floor area from occupied capacity and transit-generating intensity.
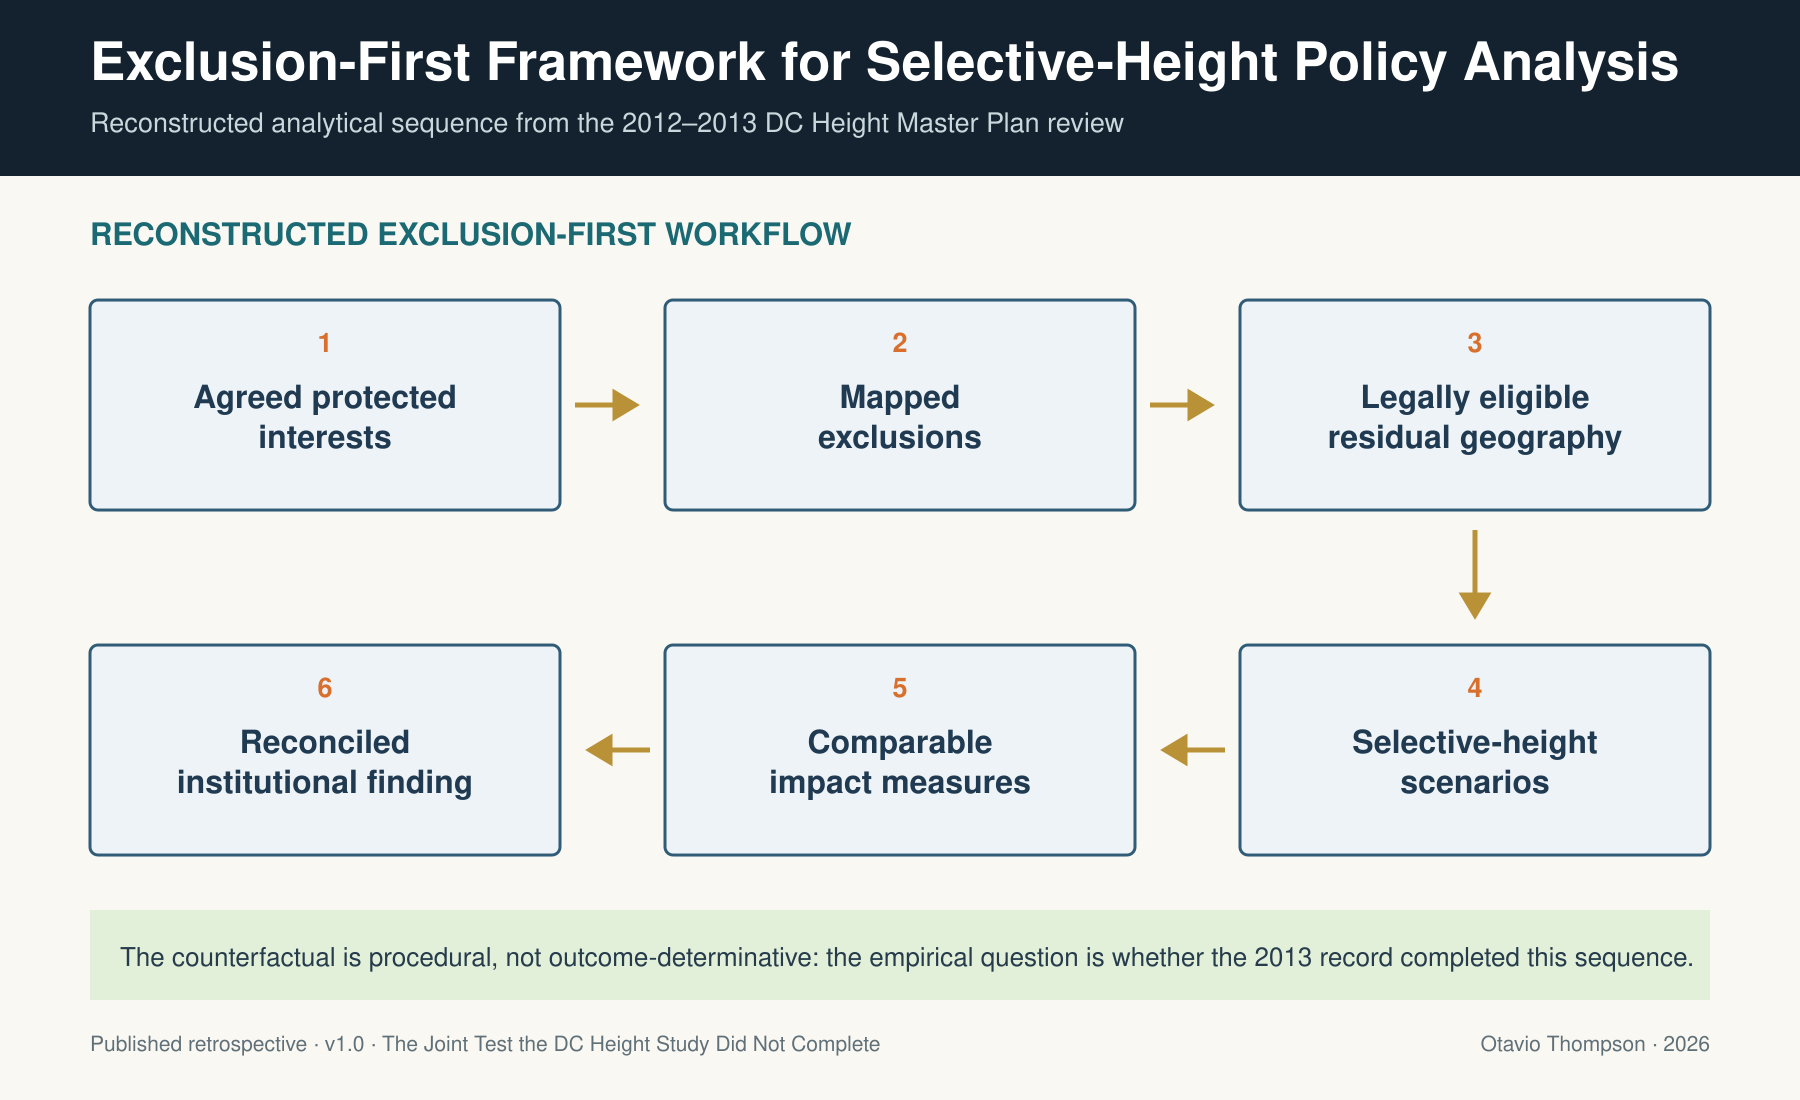
Exclusion-First Framework for Selective-Height Policy Analysis
Reconstructs the joint analytical sequence needed to evaluate selective height changes: agree on protected interests, map exclusions, identify legally eligible residual geography, test bounded height scenarios through comparable visual, capacity, economic, and urban-form measures, and produce a reconciled institutional finding.
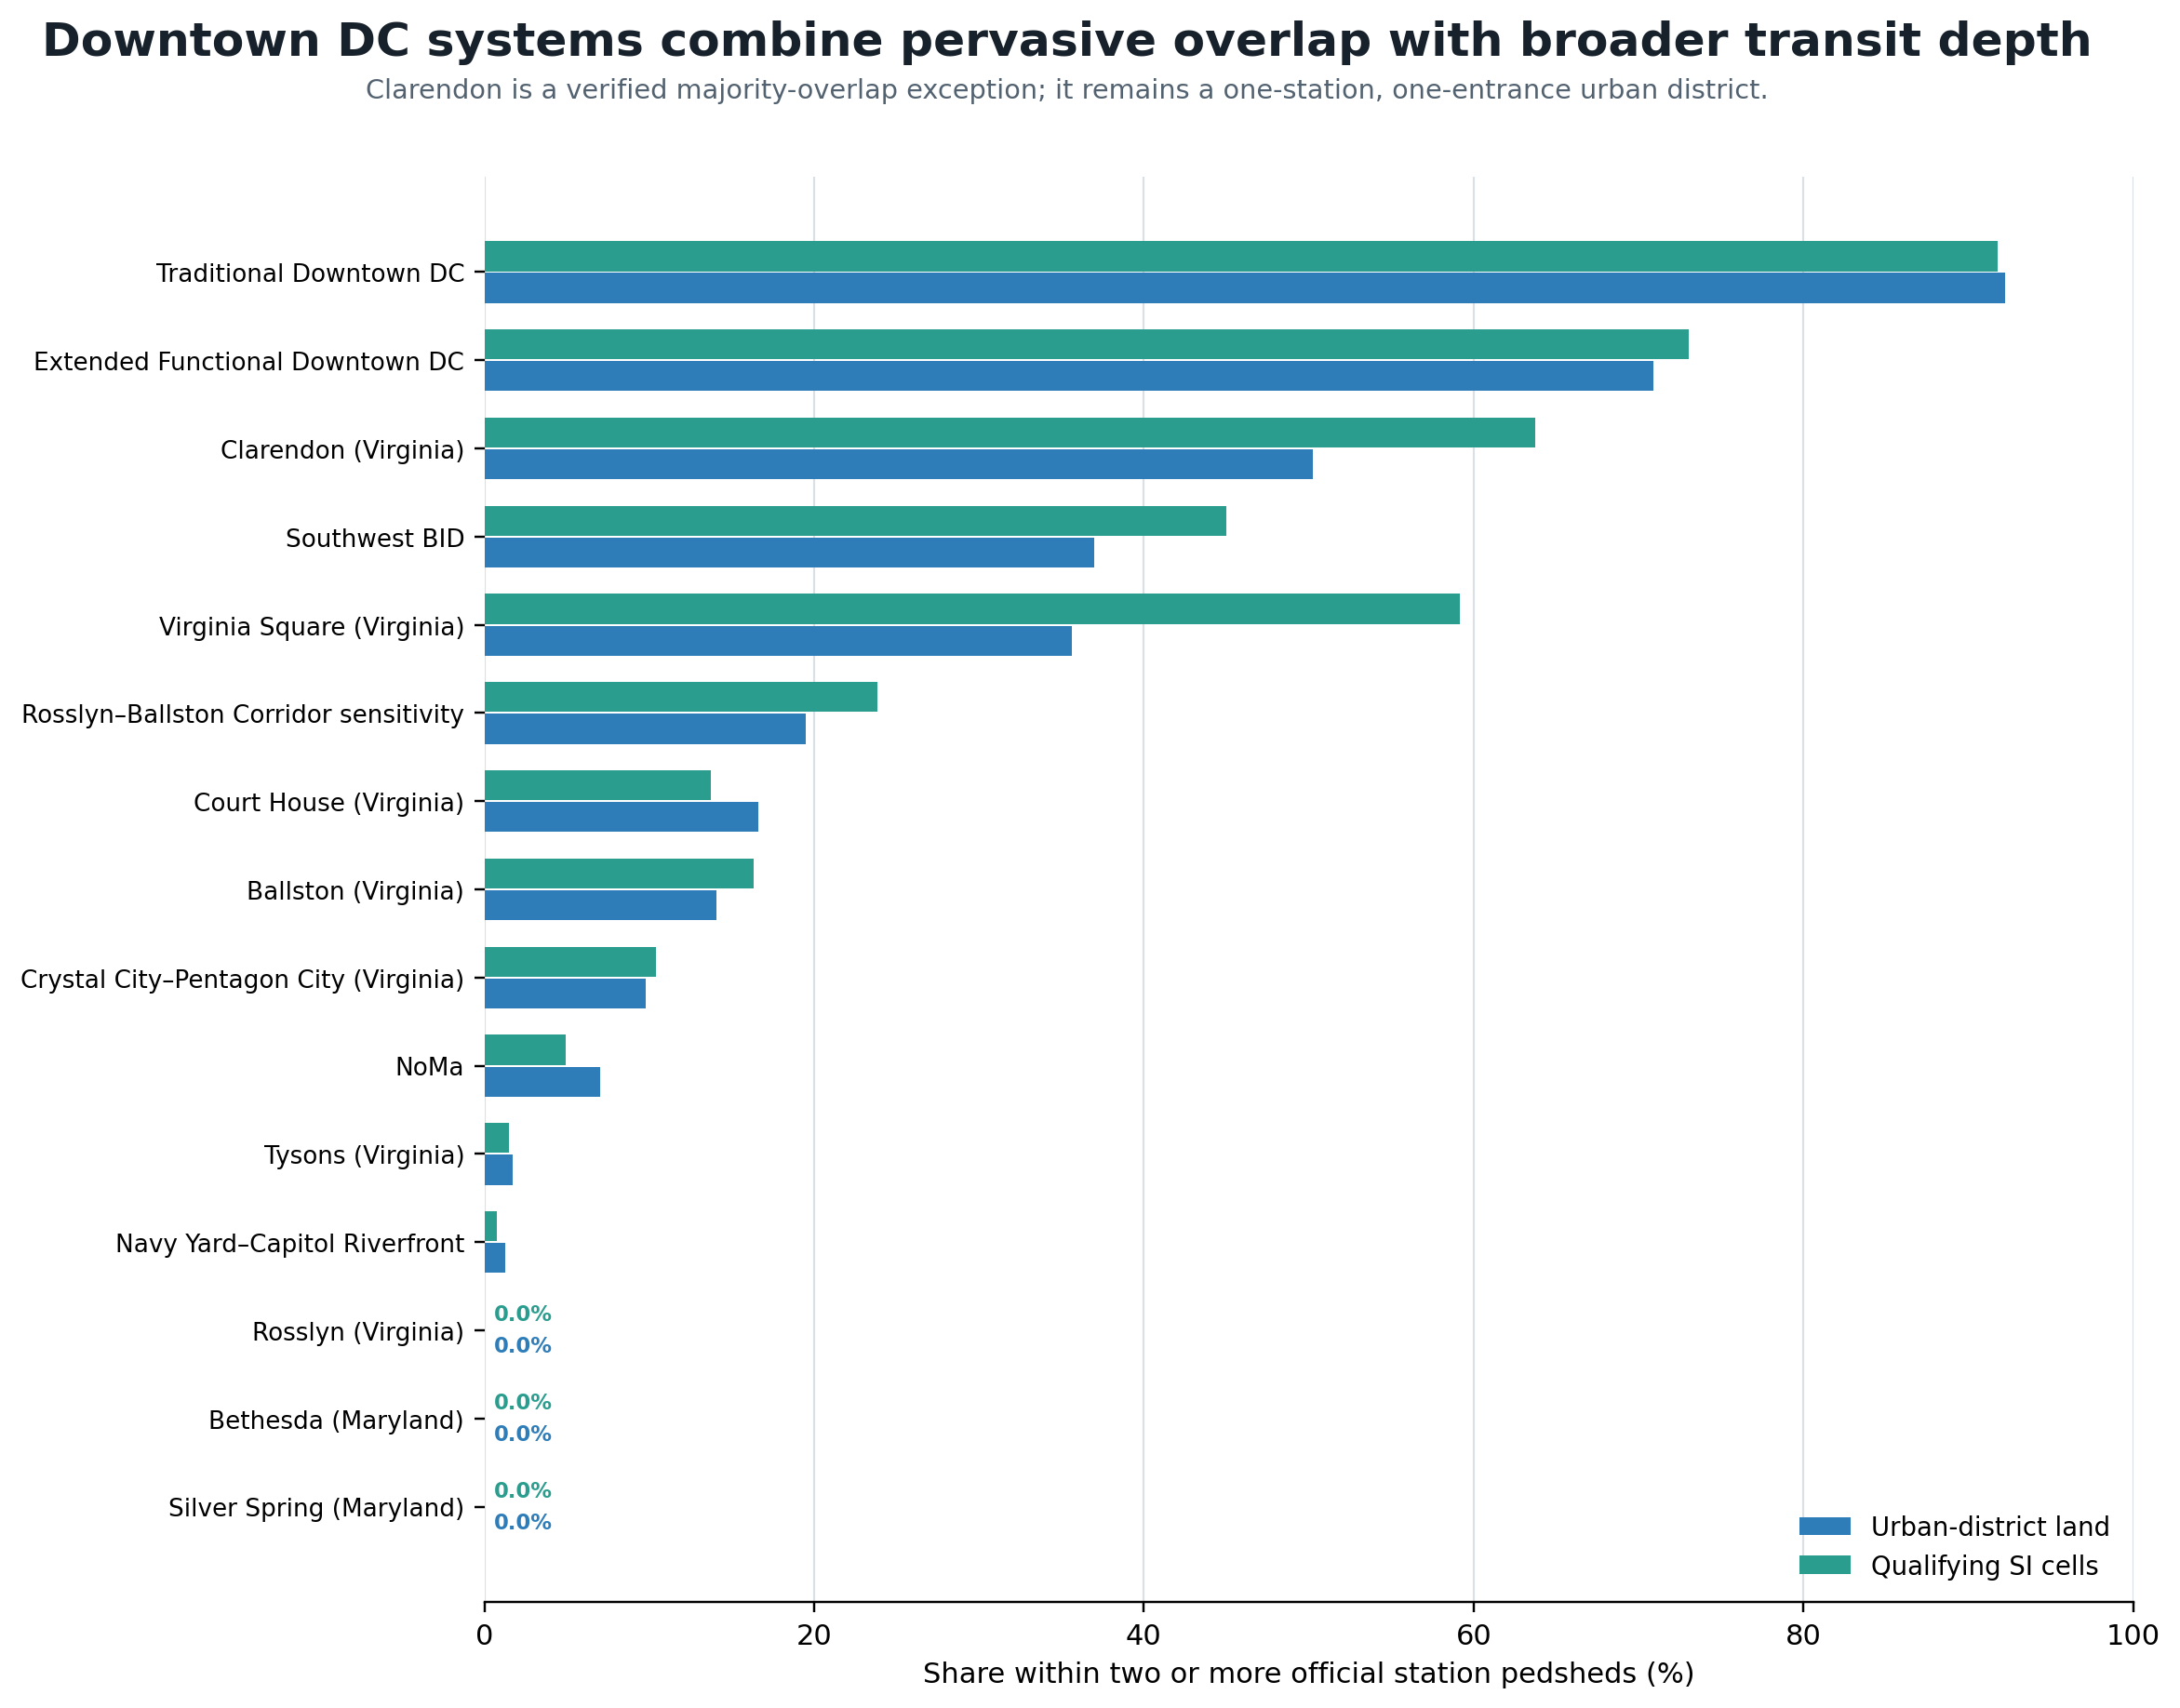
Compares the share of urban-district land and qualifying Structural Intensity cells within two or more official WMATA Metrorail station pedsheds, revealing the exceptional depth of overlapping access in Traditional Downtown DC.
 Open full-resolution PDF